Contents
burndown Parser
Description
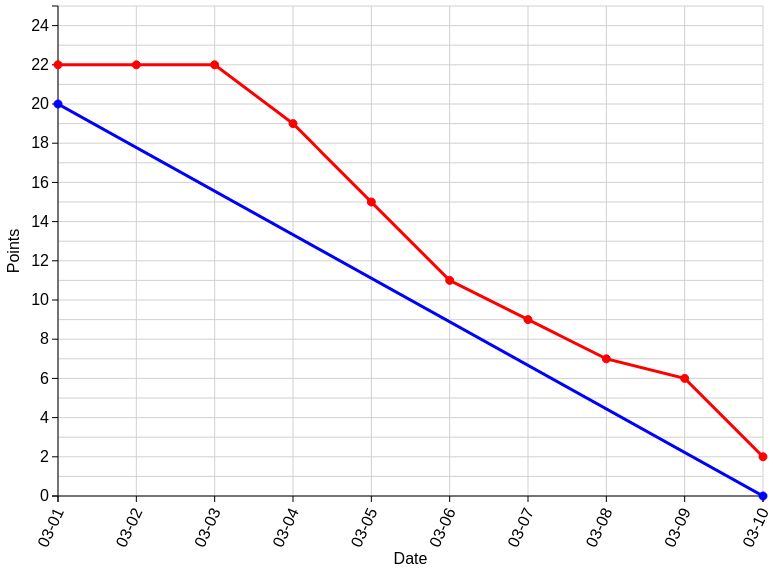
The burndown parser allows you to render burn down charts in your wiki using d3.js. See http://en.wikipedia.org/wiki/Burn_down_chart
Who should use this parser and why?
"Burn down charts" are used in Scrum-teams to visualize the work left to do versus time. If you are working on a scrum team and are interested in using burn down charts to measure your teams work-efficiency, this is your plugin! This is parser can help you to create burn down charts more easily.
Features
- Completely Free and open Source Software
- Easy installation
- Very easy to use - see the example for details
- Not a Google-charts-plugin!
- Uses the powerfull d3.js library to draw and display the chart
- natively rendered HTML5 SVG elements - not just a pre-rendered and embedded image.
- full Printable
- easily adjustable through the javascript/css code
- allows you to adjust the colors, the size of the lines, the language, the date format etc (and you are explicitly allowed to do so!).
- use either the online d3.js library or an offline version of d3.js
allows very easy plug&play usage (ffor testing purpose)
- and allows you to avoid sending your data to third partys
Download & Release Notes
Download |
Release Version |
Moin Version |
Release Notes |
1.3 |
1.9 |
Chose if you want to load d3.js from your local file system |
|
1.3 |
1.9 |
Chose if you want to load d3.js online from d3js.org. Fully "plug&play" |
|
1.3 |
1.9 |
Full source code, including all files and documents - chose if you want to make your own changes |
Installation
Either way, rename "burndown(D3.JS_from_*)" to "burndown.py" and follow the general installation instructions, see: ParserMarket/InstallingParsers.
If you chose the online version, you are done.
If you chose the local-file version, you need to get "d3.v3.min.js" from http://d3js.org/ and place it in $moinmoin_folder/MoinMoin/web/static/htdocs/comon/js. (if you want to use another location for the d3.js-file, feel free to edit the python-file.)
Usage
To use this parser, put #!burndown after the beginning of the code block.
Use "points:<number of points>" to declare the maximal remaining effort.
Use "start:<yyyy-mm-dd>" to declare the start-date of your project.
Use "end:<yyy-mm-dd>" to declare the end-date of your project.
Use "<yyy-mm-dd>:<points>" to add a measurement.
Example
{{{
#!burndown
points:20
start:2015-03-01
end:2015-03-10
2015-03-01:22
2015-03-02:22
2015-03-03:22
2015-03-04:19
2015-03-05:15
2015-03-06:11
2015-03-07:9
2015-03-08:7
2015-03-08:7
2015-03-09:6
2015-03-10:2
}}}
will be rendered as:

Copyright
2015 by Intevation GmbH Osnabrueck, Germany
Author: Sean Engelhardt
Email: sean.engelhardt@intevation.de
Contact
If you experience problems, bugs or got questions please contact
Sean Engelhardt <sean.engelhardt@intevation.de>
Bernhard Reiter <bernhard@intevation.de>
Additional
License
This parser is Free Software released under the terms of the GNU GPLv>=2.
Changelog
1.3
allowed negative values for points
fixed a bug that would draw the chart at the bottom of the page in preview mode
enhanced the grid-layout
fixed a bug that would display the same date two times if entering a very short sprint-time
The domain of the y-axis is now always a bit higher than the maximal point-value (around 10%)
1.2
cleaned the python code a lot
fixed a bug that the chart will always displayed "under" the content (d3js svg.append(...))
re-organised the source files
1.1
Some code refinement
compressed the html, css and js code
fixed a bug that the path to the javascript source was to static to use this plugin with other versions of moinmo.in (only interesting for the local d3.js version)
fixed some licence issues
1.0
initial release should be ready for productive use
current bugs
- The y-Axis may be displayed two times on a printed document. Does not happen when saving a webpage as PDF using the print function in chrome. (please add bugs here if you find some)
planned features / backlog
- check the value of a measurement on mouse-hover (popup?)
- making the chart responsive to the size of your webpage (or maybe at scale as parameter?)
- adding measure points on the "ideal" line (maybe)
- enhance the value-error output (if you enter non numeric values)
Discussion
no discussions yet
